How to Read a Soil Analysis Report: A Line-by-Line Guide
You have a page from the laboratory in front of you. pH 7.9. Lime 18%. Organic matter 1.2%. EC 1.4 dS/m. Below that, a list of elements with boxes marked "low", "sufficient" or "high". You paid for this report and spent half a day in the field collecting the sample. Yet looking at the page, no clear answer emerges about which fertiliser to buy.
The problem is not with you. A soil analysis report is not a prescription, it is an X-ray. Read correctly, it gives you the information to plan an entire season. Left unread, it sits in a folder while the fertiliser decision is made once again by guesswork, or by looking at what the neighbour applied.
This guide works through the report line by line. For each heading we answer three questions: what does this value measure, what does each range mean, and which decision does this line change?
Before the numbers: was the sample taken correctly?
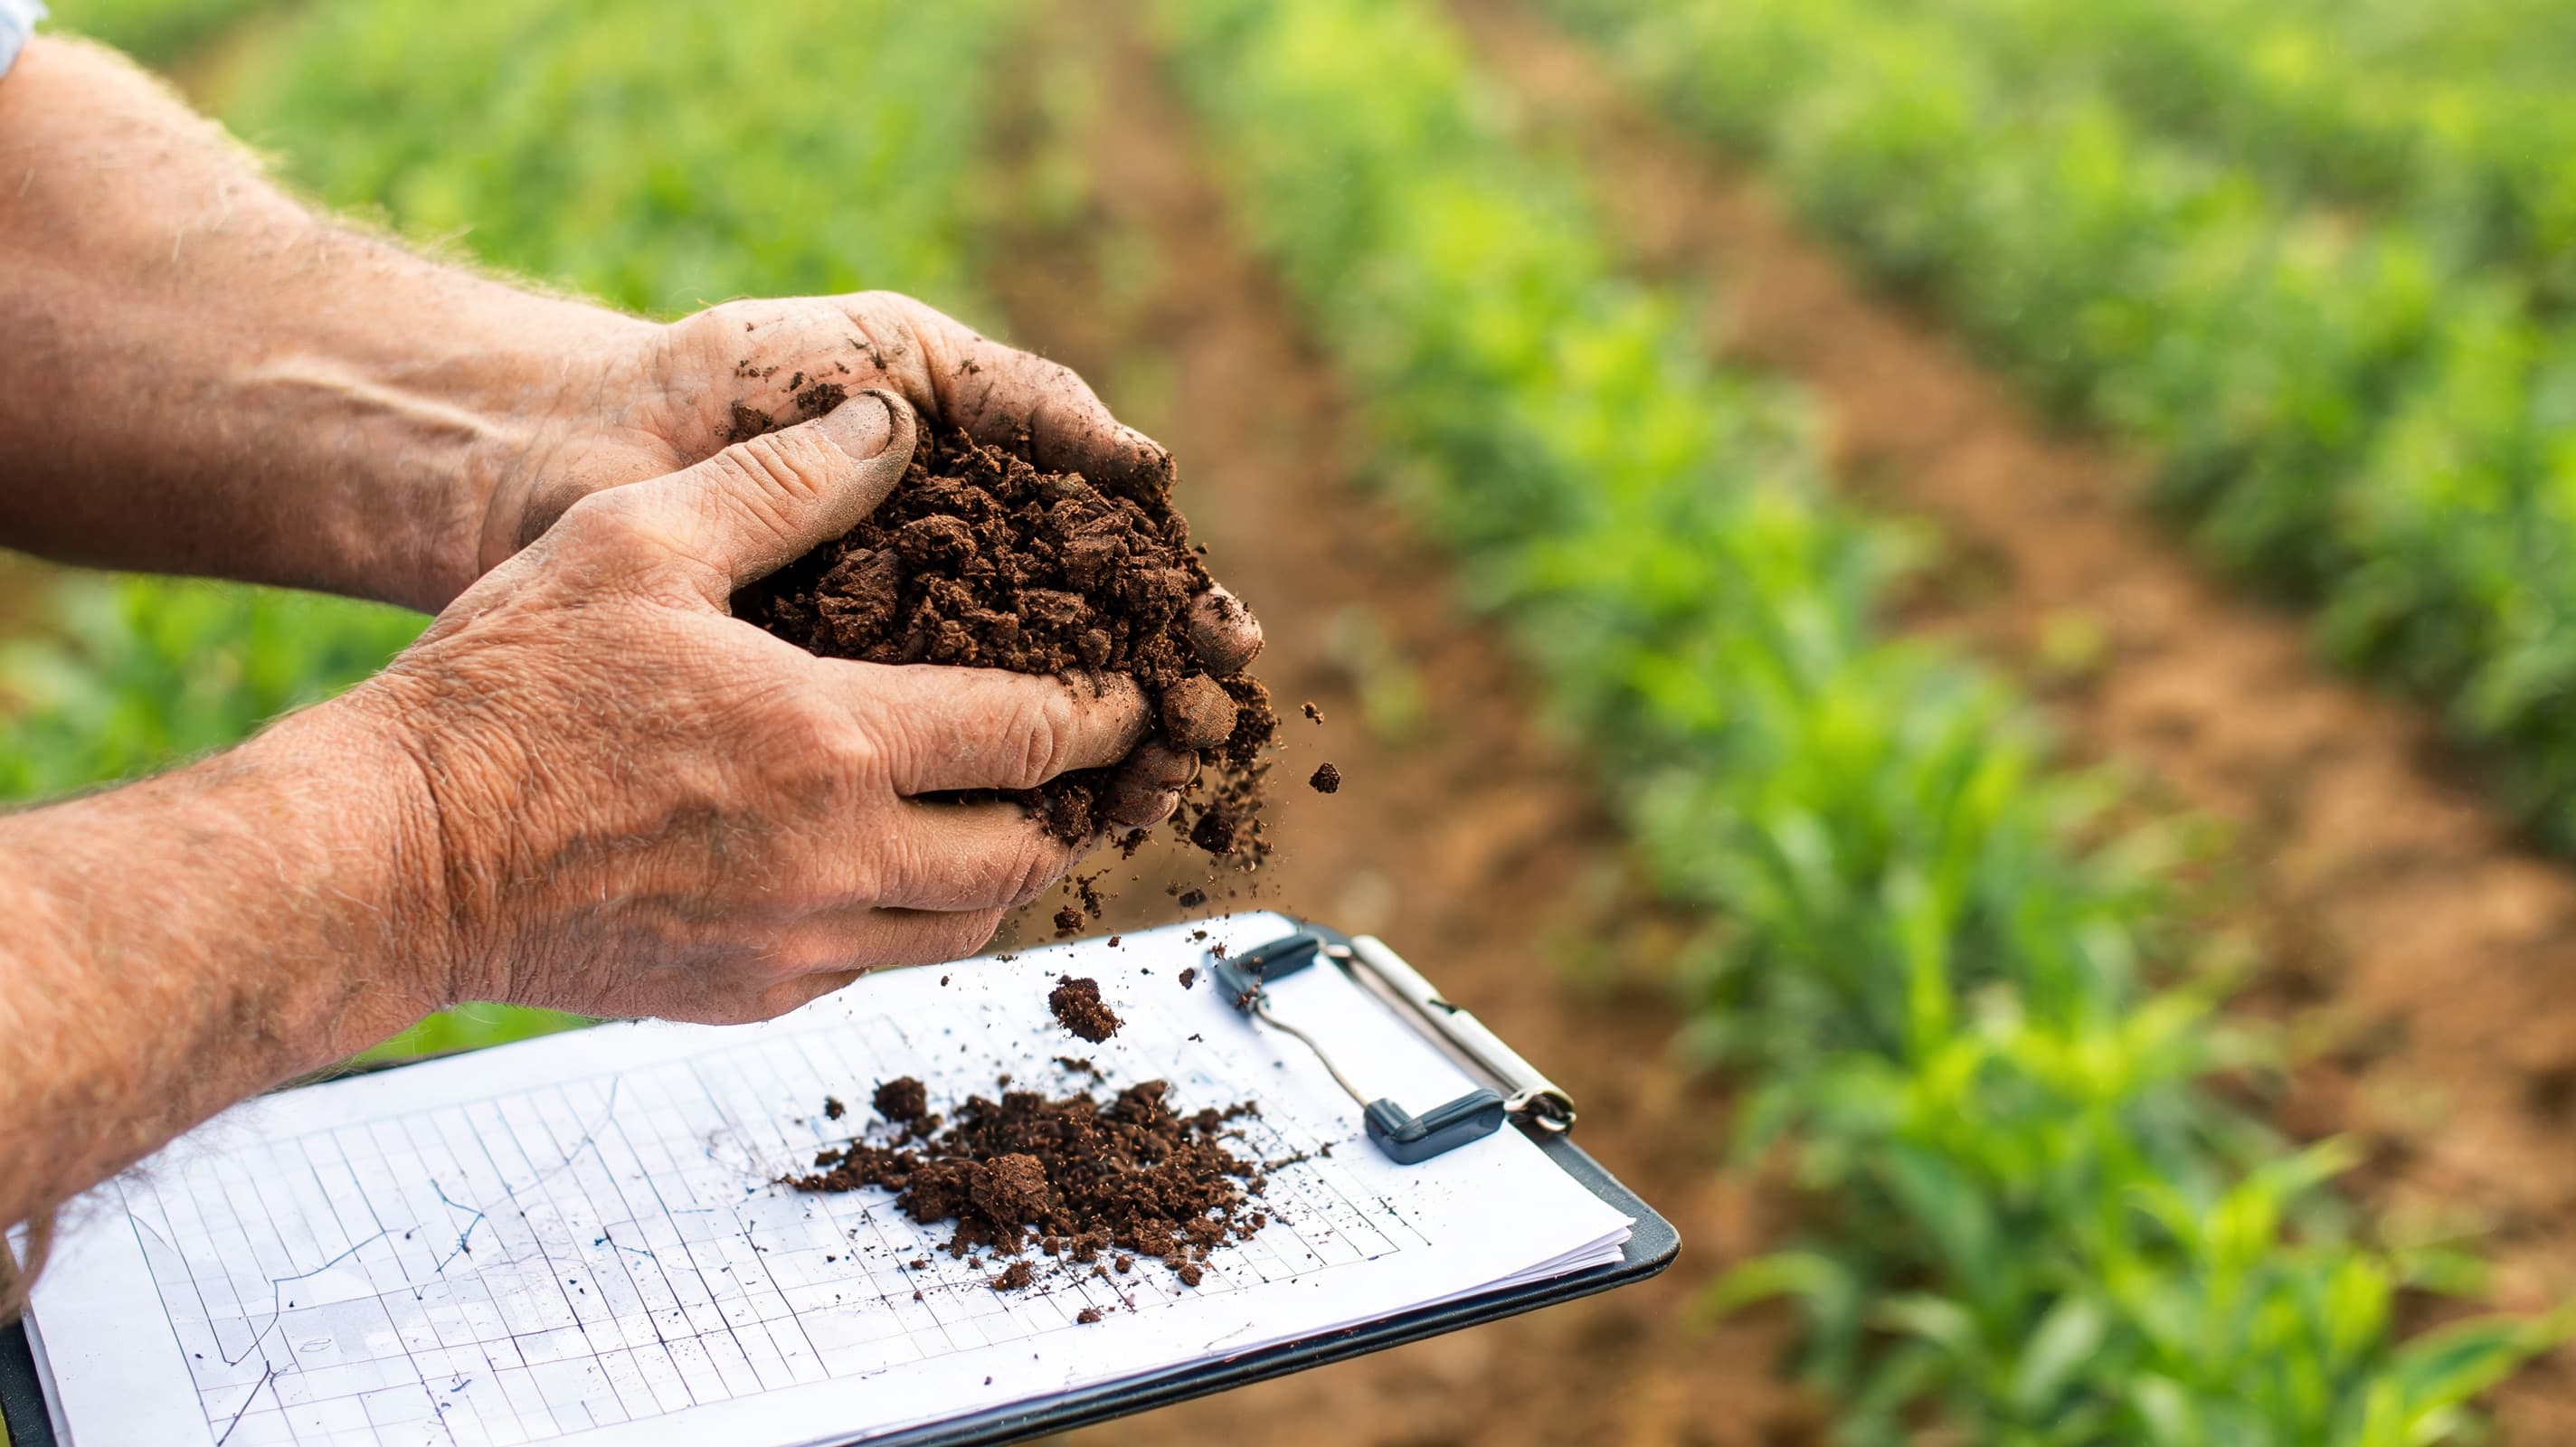
An analysis is only as accurate as the sample it was given. Every figure in the report rests on the assumption that the handful of soil you sent to the laboratory represents your field. That assumption breaks more often than people think.
Points to watch when sampling:
- Never sample from a single point. Walk a zigzag pattern across the parcel, take soil from 10 to 15 separate points, mix them in a bucket and draw a single sample of roughly 1 kg from that mix.
- Depth depends on the crop. For annual vegetables and field crops, 0 to 30 cm is the usual working depth. In orchards, two separate depths, 0 to 30 cm and 30 to 60 cm, give far more useful information because roots go deeper.
- Leave outliers out. The spot where the manure pile stood, water-logged depressions, the field entrance, the threshing area and field margins should not enter the sample. These points distort the average.
- A visibly different area is a separate sample. If one zone of the same parcel consistently performs worse, it should be sent as its own sample. Mixed in, the problem disappears into the average.
- Keep the timing consistent. After harvest and before fertilisation is a common preference. What matters is always sampling in the same period so that year-on-year comparison is possible.
If your report contains an unexpected result, review how the sample was taken before you start recalculating anything.
pH: the master key to the whole report
pH is the degree of acidity or alkalinity of the soil solution. It is the single most important line in the report, because pH is not a nutrient itself but governs the availability of every other nutrient to the plant.
The general assessment ranges are as follows:
| pH range | Description | Practical meaning |
|---|---|---|
| Below 5.5 | Strongly acidic | Aluminium and manganese solubility rises, root development is suppressed, calcium and magnesium leach away |
| 5.5 - 6.5 | Slightly acidic | The range in which nutrient availability is widest for most crops |
| 6.5 - 7.5 | Neutral | Generally trouble-free, micronutrients approach their limit |
| 7.5 - 8.5 | Alkaline | Iron, zinc, manganese and phosphorus availability drop markedly |
| Above 8.5 | Strongly alkaline | Sodicity is suspected, structural and permeability problems are expected |
A significant share of soils in Türkiye, particularly across the Mediterranean and Central Anatolia, sit above neutral and are calcareous. The most common consequence in this picture is simple: the iron is in the soil, but the plant cannot take it up.
So when you read the pH line, ask this: which elements are locked at this pH? The answer changes your fertiliser choice directly. On a soil above pH 7.5, applying iron in sulphate or oxide form often produces no result; chelated forms come into play, particularly the EDDHA form which retains its stability at high pH.
Lime (CaCO₃): the quiet determinant of Mediterranean soils
Lime appears in the report as "total lime" and sometimes separately as "active lime". These are two different things and should not be confused.
Total lime is all the calcium carbonate in the soil. Active lime is the fine, chemically reactive fraction of it. What actually affects the plant is active lime. A soil with high total lime but low active lime may show no iron chlorosis, while the reverse situation makes the problem unavoidable.
The practical consequences of high lime are:
- pH is buffered and stays high. Permanently lowering pH with sulphur or acid applications is economically difficult on highly calcareous soils.
- Phosphorus combines with calcium and converts into compounds the plant cannot access. This process is called phosphorus fixation.
- Iron and zinc availability falls. Interveinal yellowing on young leaves is the most typical indicator.
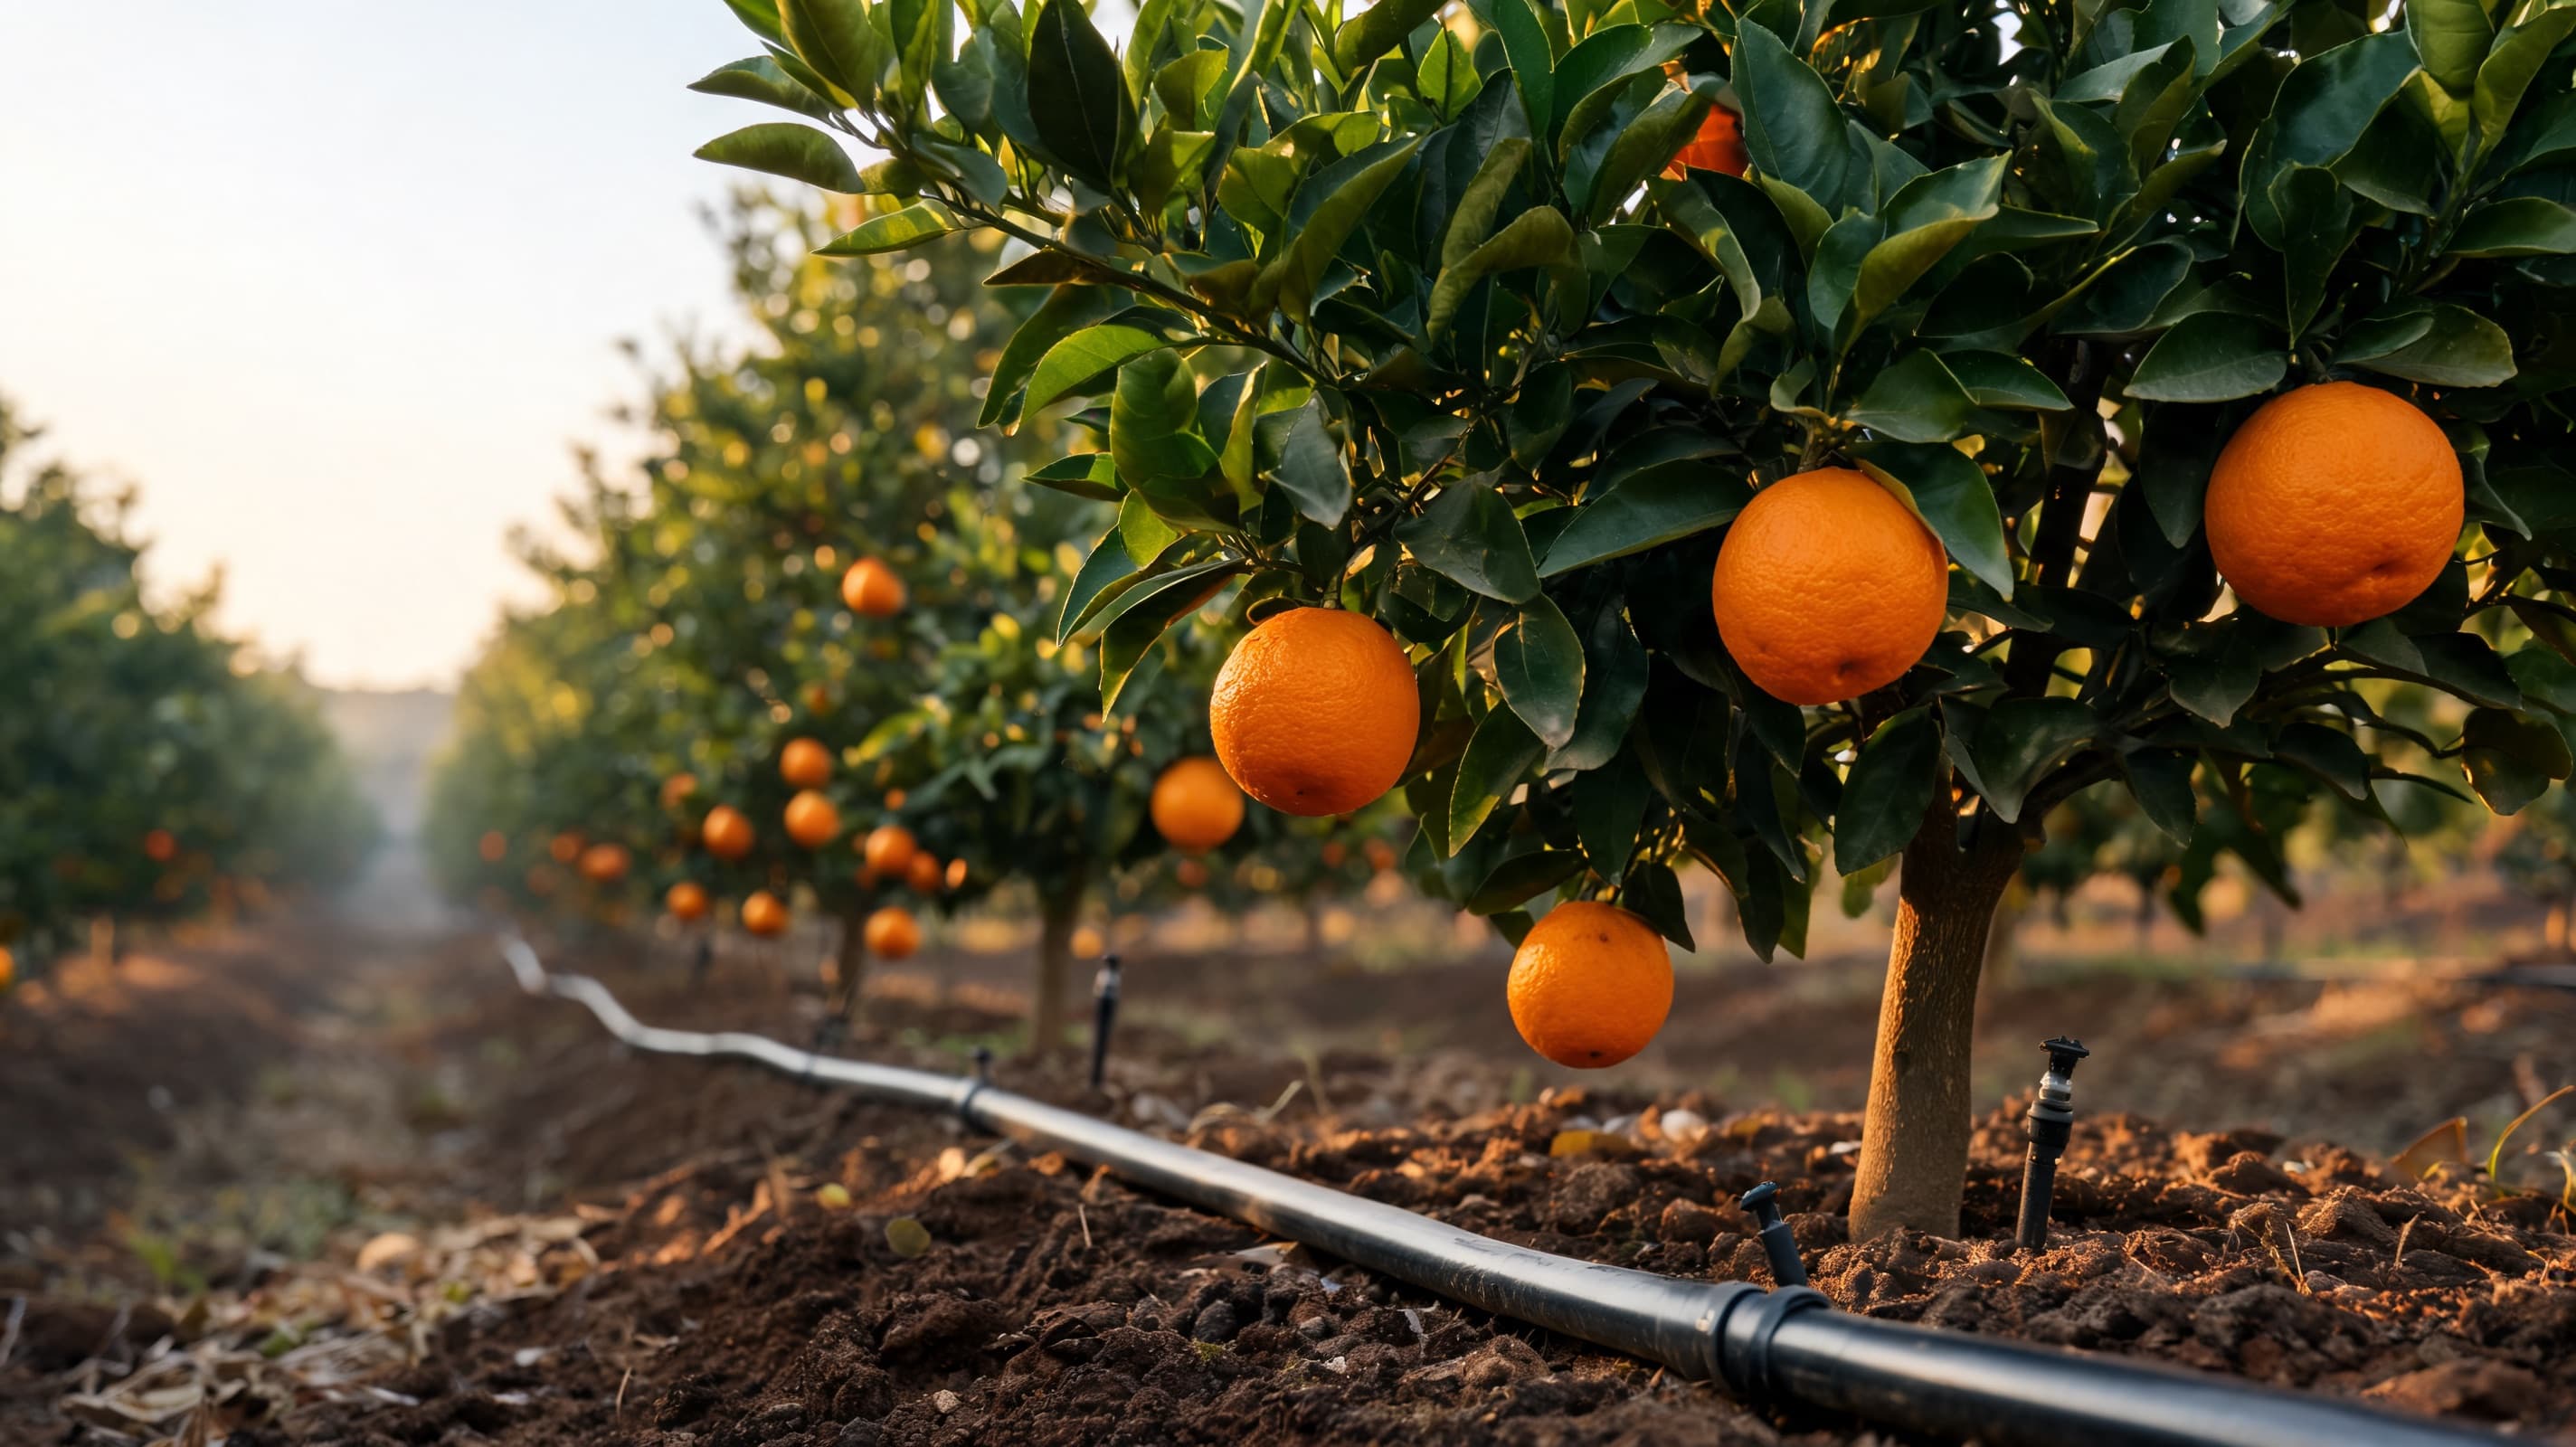
In this picture the strategy is not "change the soil" but "manage the root zone". Delivering phosphorus to the root zone through the drip line rather than broadcasting it, using iron in chelated form, and building buffering capacity with organic matter is the accepted way of working with calcareous soil.
EC: the root's capacity to drink water
EC is electrical conductivity and indicates the total quantity of dissolved salts in the soil solution. The unit is usually dS/m or mS/cm.
As EC rises, the osmotic pressure of the soil solution increases. The root has to spend more energy to draw water from the soil. Above a certain threshold, the plant cannot take up water even though water is present in the soil. In the field this picture is often mistaken for drought and more irrigation follows, which can concentrate salt in the root zone even further.
Three points matter when interpreting it:
- Is the measurement method stated? Saturation extract, 1:2.5 and 1:5 dilution methods have different threshold values. Comparing ranges without knowing the method is misleading.
- What is the crop's tolerance? Barley and cotton are relatively tolerant. Strawberry, bean and citrus are sensitive. The same EC value may be harmless in one crop and cause marked stress in another.
- Has the irrigation water EC been measured? The source of salinity is frequently the irrigation water rather than the soil. Interpreting soil EC without a water analysis means seeing half the picture.
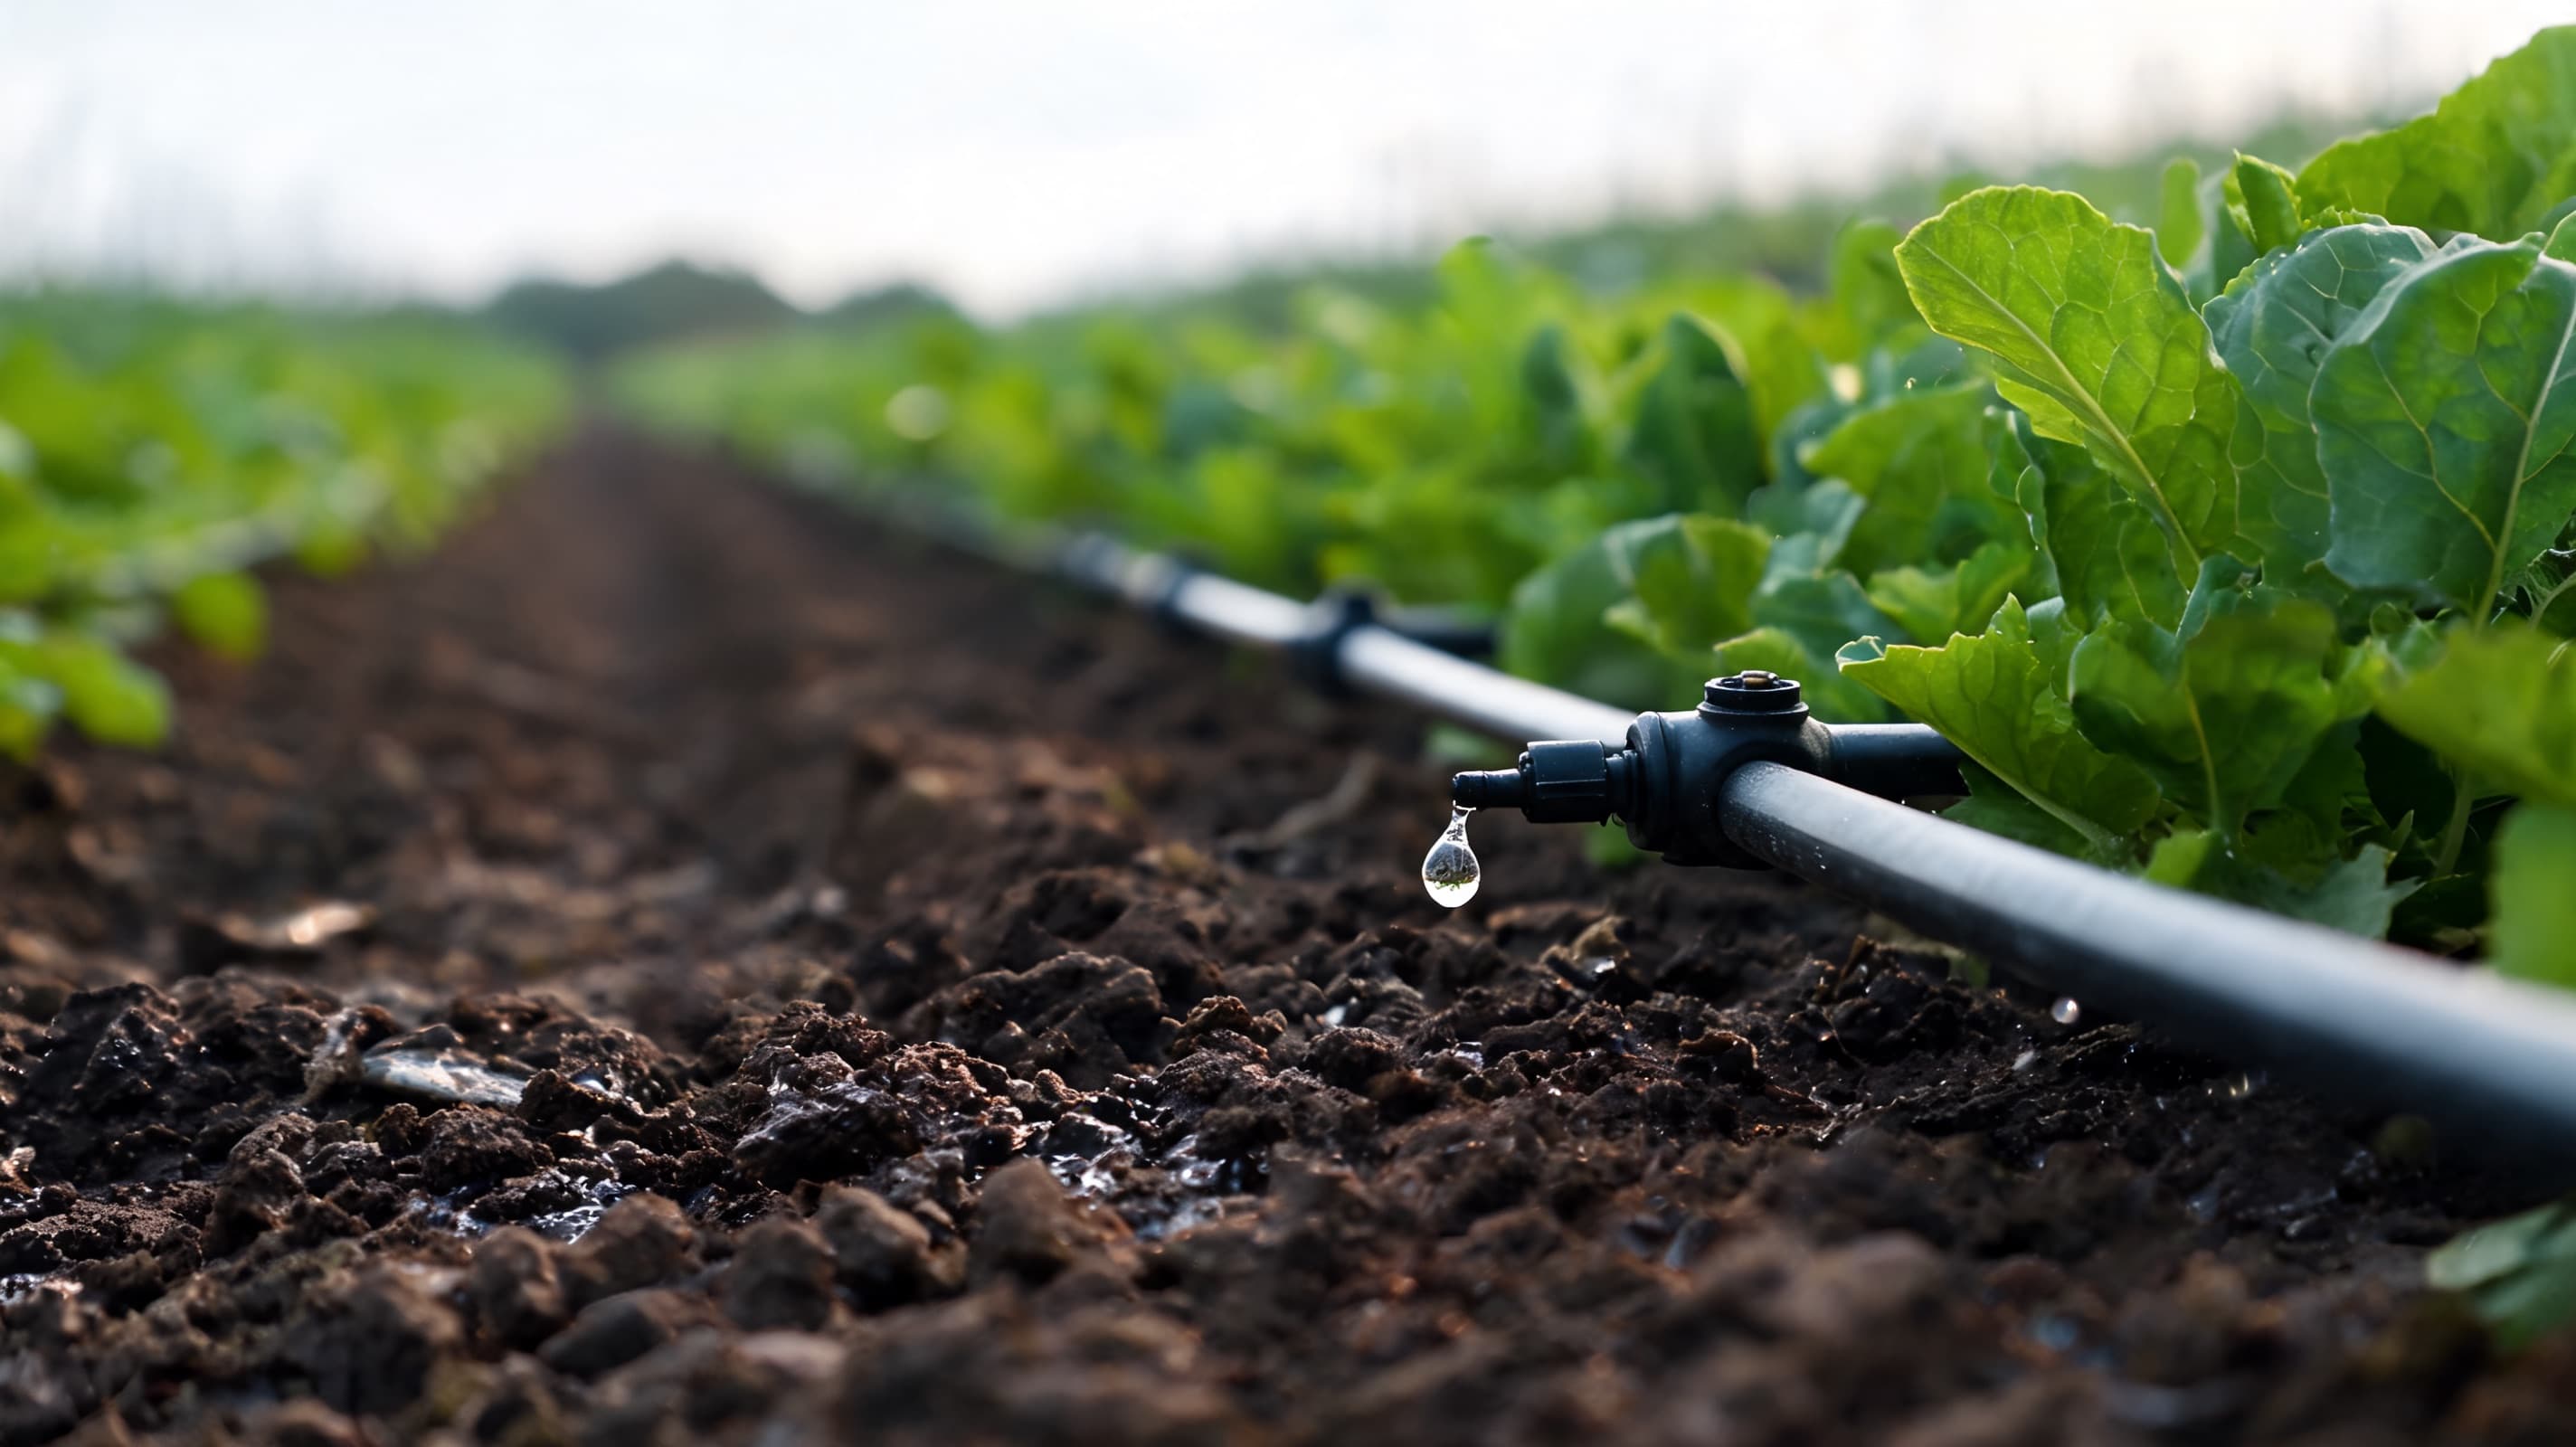
Where EC is high, leaching water management and drainage take priority. On the fertiliser side, low salt index sources and split applications are preferred. Our detailed content on managing soils under salt pressure is in the saline soil and high EC guide.
Organic matter: the soil's memory
Organic matter usually appears in the report as a value between 1% and 4%. Across the majority of agricultural soils in Türkiye this figure sits below 2%.
This line does not report a nutrient quantity on its own. Instead it summarises the following soil capacities:
- Water holding. Organic matter can hold many times its own weight in water. Soil low in organic matter demands more frequent irrigation.
- Cation exchange capacity. It allows cations such as potassium, calcium, magnesium and ammonium to be retained in the soil. Where it is low, the fertiliser you apply leaches away.
- Microbial life. It is the food source for soil organisms. Nutrient cycling runs from here.
- Structure and aeration. It supports aggregate formation and reduces compaction.
Where organic matter is low, no single-season application will raise the value permanently. This is long-haul work: farmyard manure, green manure, residue management and regular use of humic and fulvic acid based products all work together. Markka's Doca-22, Nexxus, Humiwicks and Fulvic Powder products sit in this category; Nexxus, for example, contains 20% organic matter and 22% humic plus fulvic acid. We covered how humic and fulvic acid work in the soil in a dedicated article.
Macronutrients: reading the N, P and K lines
Nitrogen (N). The nitrogen figure is the shortest-lived piece of information in a soil test. Nitrate nitrogen is highly mobile in water and can move below the root zone after a single rainfall event. For this reason the nitrogen decision rests not on the soil analysis alone but on the crop's growth stage, the target yield and the soil's organic matter content. The difference between nitrogen sources also matters; we compared the behaviour of urea, ammonium and nitrate forms in our nitrogen forms guide.
Phosphorus (P). Usually given as "available phosphorus" in ppm or kg per decare. Interpreting it means going back to the pH line: at high pH and high lime, phosphorus is bound by calcium; at low pH it is bound by iron and aluminium. The range in which phosphorus is most readily taken up is roughly pH 6.0 to 7.0. Phosphorus moves slowly in soil, so placement close to the root is preferred over surface broadcasting.
Potassium (K). Available potassium leaches rapidly on sandy soils, while on clay soils it can become fixed between clay layers and may be less accessible than the analysis suggests. Always read the potassium line together with the cation balance.
Cation balance: the ratio that matters more than any single element
This is the most frequently skipped yet most informative section of the report. Cation exchange capacity (CEC) and the saturation percentages show the soil's nutrient holding capacity and which elements are occupying that capacity.
Where CEC is low (sandy soils), the soil cannot retain nutrients. On these soils, split applications spread across the season make more sense than a single high dose. Where CEC is high (clay soils and those rich in organic matter), the soil holds nutrients but sometimes holds them too tightly.
In the saturation percentages, the critical point is the ratio of calcium, magnesium and potassium to one another. These three cations compete for uptake at the root surface. When one becomes excessive it suppresses uptake of another. This is called antagonism.
The two most frequently encountered pictures in the field are:
- Magnesium high, potassium suppressed. Even if potassium appears "sufficient" in the soil, the plant cannot take it up.
- Potassium applied heavily, magnesium suppressed. Interveinal yellowing begins on older leaves. We covered this picture in detail in our magnesium deficiency article.
This is why looking at one element's figure and raising the dose is a risky habit. The decision is made by looking at ratios.
Micronutrients: small quantities, large effect
Iron, zinc, manganese, copper and boron are usually reported in ppm. What these elements share is that the required quantity is very small while the gap between deficiency and toxicity is narrow. Boron is the most sensitive of all; the distance between insufficiency and excess is markedly shorter than for other elements.
Always read the micronutrient lines alongside pH. Above pH 7.5, iron, zinc and manganese values may read "sufficient" while deficiency symptoms still appear in the plant, because the analysis measures the quantity in the soil, not what the plant can take up. When you see this discrepancy, leaf analysis comes into play.
We examined why iron chlorosis emerges on calcareous soil and how chelate selection is made in our iron chlorosis guide.
Turning the report into a programme: a five-step reading order
Reading the report in the same order every time prevents lines from being overlooked.
- Read pH and lime first. These two values determine how every other line is to be interpreted.
- Look at EC. If salt pressure exists, water and drainage management is discussed before the nutrition programme.
- Note the organic matter. If it is low, this is a separate heading spread over years and is not confused with the seasonal fertiliser decision.
- Evaluate macronutrients and cation balance together. Read the ratio, not the single element.
- Filter micronutrients through pH. Even where the figure is sufficient, availability is questioned.
When these five steps are complete you hold not a fertiliser list but a priority list. Product and rate decisions are then built on those priorities, on the product label and on the conditions of your region.
Common mistakes
- Treating the report as a prescription in itself. The analysis is an input to the decision, not the decision. Crop, target yield, irrigation water quality and climate all enter the equation.
- Ignoring the measurement method. Different methods have different thresholds. Reading a value one laboratory calls "sufficient" against another laboratory's scale produces the wrong conclusion.
- Not comparing across years. A single report is a photograph; stacked reports are a film. You can only see which direction your soil is heading in a series.
- Skipping the irrigation water analysis. In salinity and bicarbonate problems in particular, the real source is the water.
- Trusting the micronutrient figure and ignoring the symptom. If the plant shows a symptom, leaf analysis is requested even where the soil test reads sufficient.
Frequently Asked Questions
How often should a soil analysis be carried out? Common practice is annually or every two years for annual crops, and every two to three years for perennial orchards. The interval is shortened on a problem parcel or when moving to a new practice. What matters is always taking the sample in the same period and by the same method; only then can you compare across years.
What should soil pH be? For most crops the range in which nutrient availability is widest is roughly 6.0 to 7.0. However, the "ideal pH" varies by plant. Acid-loving species such as blueberry prefer values around 5.0, while many field crops perform well near neutral. Assess pH not on its own but together with the lime content.
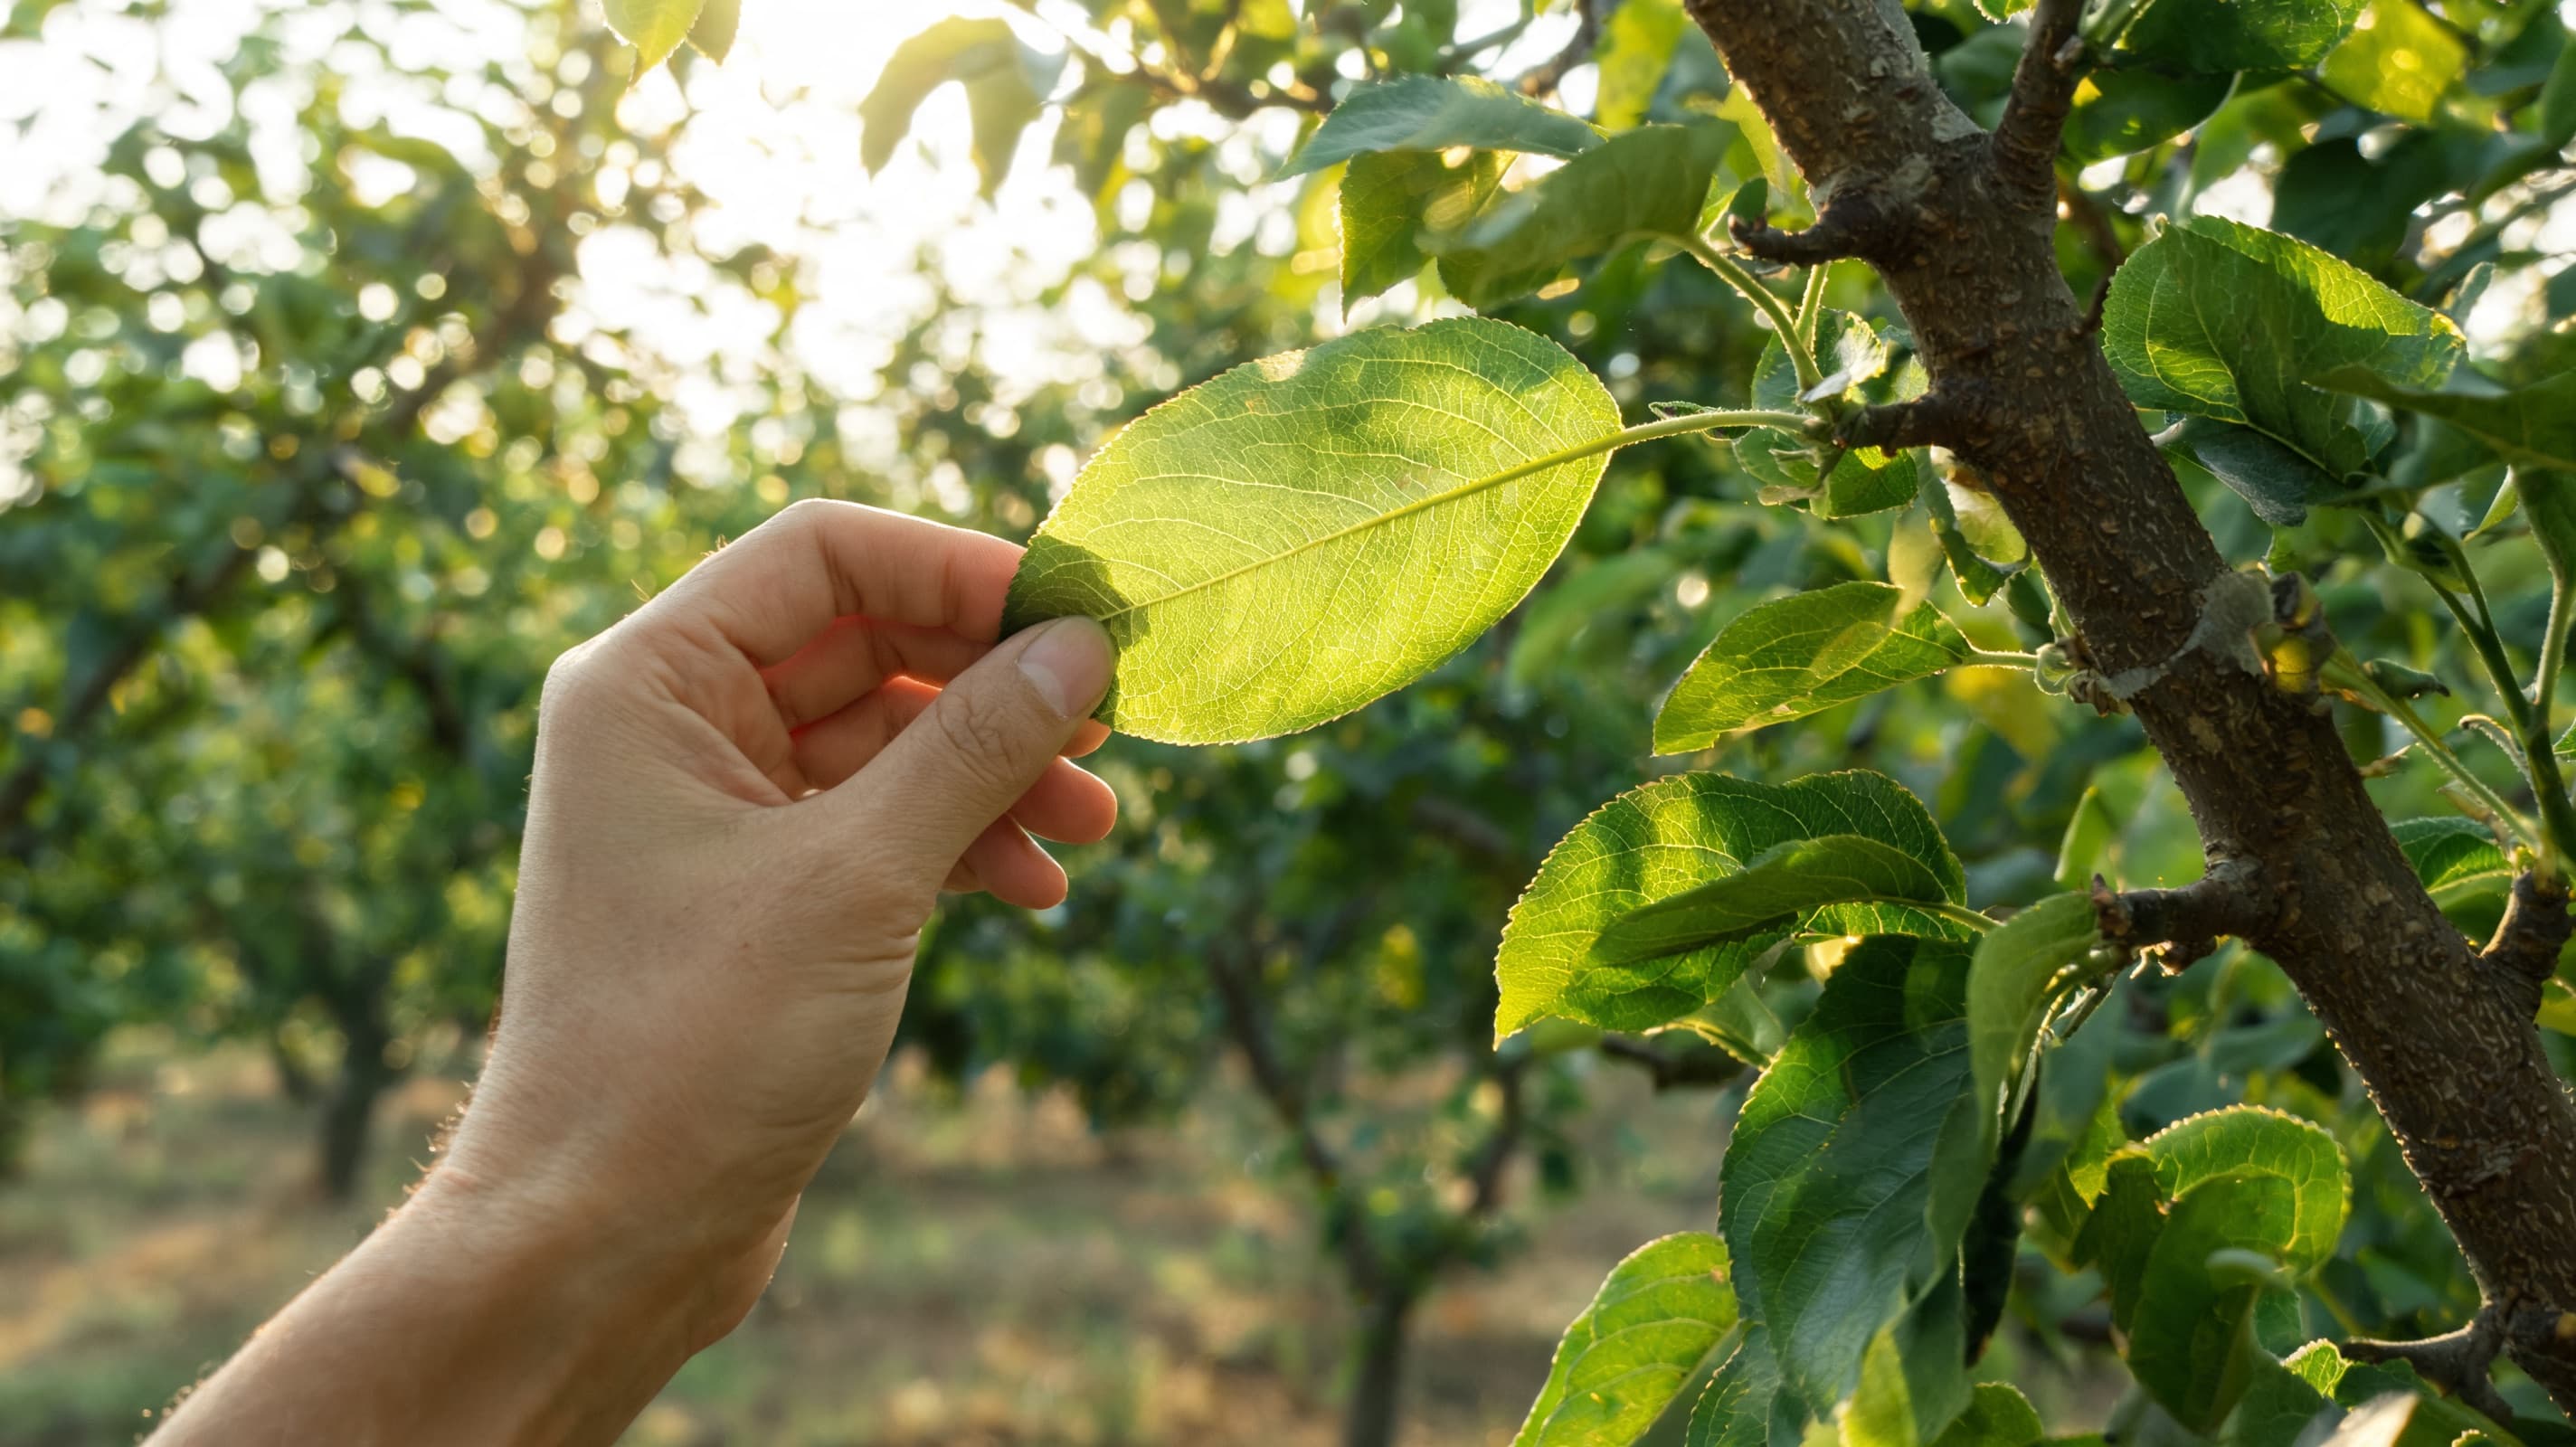
What is the difference between soil analysis and leaf analysis? A soil analysis measures the quantity of nutrients present in the soil. A leaf analysis shows how much the plant has actually been able to take up. If an element reads sufficient in the soil while the plant shows deficiency symptoms, only leaf analysis explains the gap. The two are complementary, not competing.
What should EC be in a soil analysis report? Giving a single threshold would be misleading, because the assessment depends both on the measurement method and on the crop's salt tolerance. Check whether the measurement method is stated in the report and compare the value against the tolerance range of the crop you grow. Always have the irrigation water EC measured as well.
Why does cation balance matter more than individual element values? Calcium, magnesium and potassium compete with one another for uptake at the root surface. If one is excessively high, another may not be taken up by the plant even though it is present in sufficient quantity in the soil. For this reason the rate decision is based on the ratio between elements rather than a single element's figure.
Conclusion
A soil analysis report is a letter your field sends you. What is written in it is not how much of each element is present, but how your soil works. pH and lime set the frame, EC draws the limit, organic matter describes the capacity, and cation balance shows which nutrient is genuinely accessible.
Once you learn to read these lines, fertiliser selection stops being guesswork. You make the decision; we are simply there to show which formulation fits it.
If you would like to go through your report together, you can reach us via our contact page or consult your nearest Markka distributor. You can review which need each of our product groups addresses in our product catalogue.